Chilean harbour tug fleet: fuel per engine hour held steady for 18 months
Fitted harbour tugs held their fuel use per engine hour for 18 months after docking, while an unfitted tug in the same fleet rose 27%.
A Chilean harbour tug operator fitted GLOBAtech ultrasonic antifouling to its tugs at docking from July 2018. Over the next 18 months the first fitted tug’s fuel use per engine hour stayed within about 5% of its first quarter after docking, while an unfitted tug in the same fleet kept climbing: up 27% in the second half of 2019 against 2018, as the fitted tugs came down 3%.
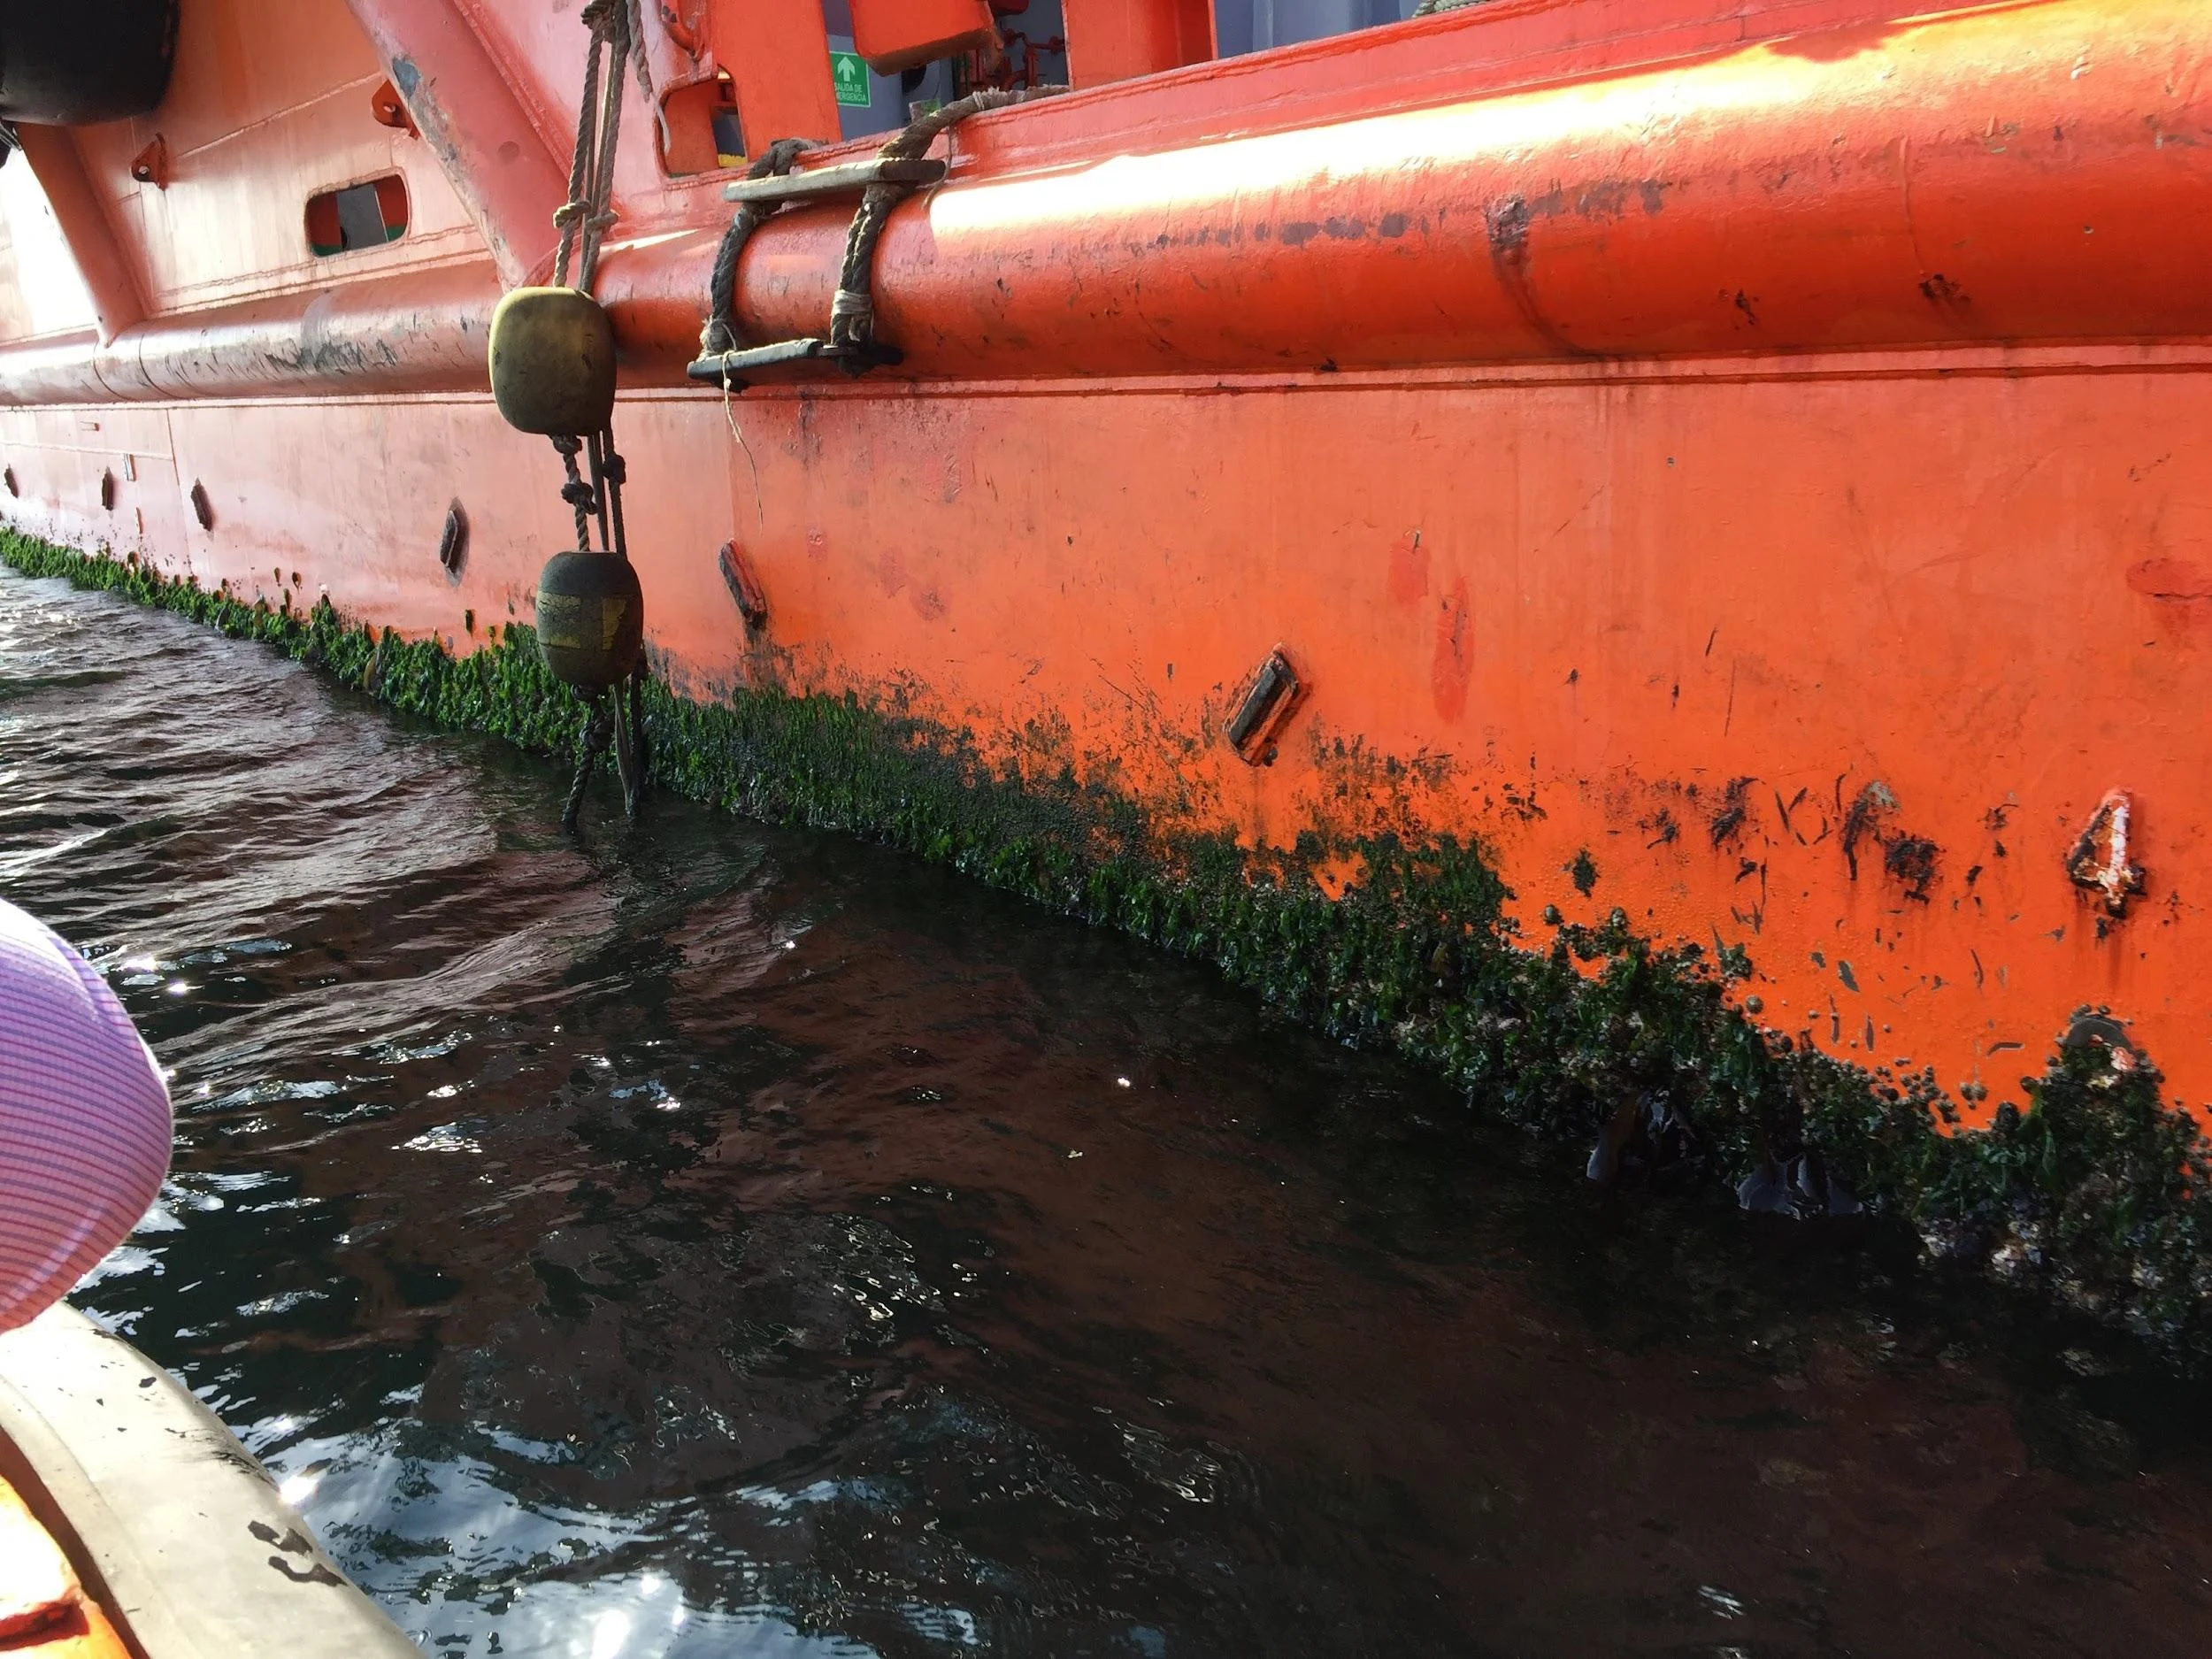
The operator runs harbour tugs and port launches in the Valparaíso Region. The tugs spend long hours alongside or at low speed in cold, productive water, and every tug that came in for fitting showed the same thing: weed and barnacles at the waterline, and heavy fouling on the hull and running gear by the time it reached the dock.
What was fitted
From July 2018, at docking: GLOBAtech’s H2oBioSonic system, the predecessor of ENVSonic. Control modules on board, transducers bonded to the inside of the hull, working alongside the existing antifouling paint. Seven tugs and the operator’s launches, ten vessels in all, were protected by November 2019, installed and supported by GLOBAtech’s Chilean partner. From 2020 the partner also trialled fitting before an underwater clean, so a vessel did not have to wait for its next docking.
What the data showed
The partner tracked fuel burned per main-engine hour from the operator’s records, tug by tug and quarter by quarter. Fouling builds from the day a tug leaves dock, so an unprotected hull burns a little more each quarter; a protected one should hold its line.
The first fitted tug held within 5% for 18 months while the unfitted tug kept climbing
Fuel burned per main-engine hour by quarter, indexed: each tug’s first quarter shown = 100
Index (first quarter = 100)
Other fitted tugs
The first fitted tug held within 5% for 18 months while the unfitted tug kept climbing
Series
Q3 2018
Q4 2018
Q1 2019
Q2 2019
Q3 2019
Q4 2019
Unfitted tug
100
112
112
112
140
188
First fitted tug
100
100
98
96
95
101
Other fitted tugs #1
–
100
98
104
102
69
Other fitted tugs #2
–
100
88
96
88
87
Other fitted tugs #3
–
–
–
–
100
99
Other fitted tugs #4
–
–
–
–
100
88
Other fitted tugs #5
–
–
–
–
100
97
Source: GLOBAtech’s Chilean partner, results review of December 2019, from the operator’s fuel and engine-hour records. The operator’s figures are confidential: values are indexed and read from the partner’s charts, rounded. One unfitted comparison tug; not an independent trial.
Second half of 2019 against 2018: up 27% without the system, down 3% with it
Average fuel burned per main-engine hour, July to December, indexed: second half of 2018 = 100
Index (second half of 2018 = 100)
Second half 2018
Second half 2019
Second half of 2019 against 2018: up 27% without the system, down 3% with it
Series
Without the system
With the system
Second half 2018
100
100
Second half 2019
127
97
Source: GLOBAtech’s Chilean partner, results review of December 2019, from the operator’s fuel and engine-hour records. The operator’s figures are confidential: values are indexed and read from the partner’s charts, rounded. One unfitted comparison tug; not an independent trial.
What it was worth
Our partner’s estimate: had the first fitted tug deteriorated like the unfitted one, a 28% rise, it would have burned about 47,000 litres more diesel over its 850 main-engine hours in 2019. That is one tug in one year, and roughly 125 tonnes of CO₂.
Hull condition
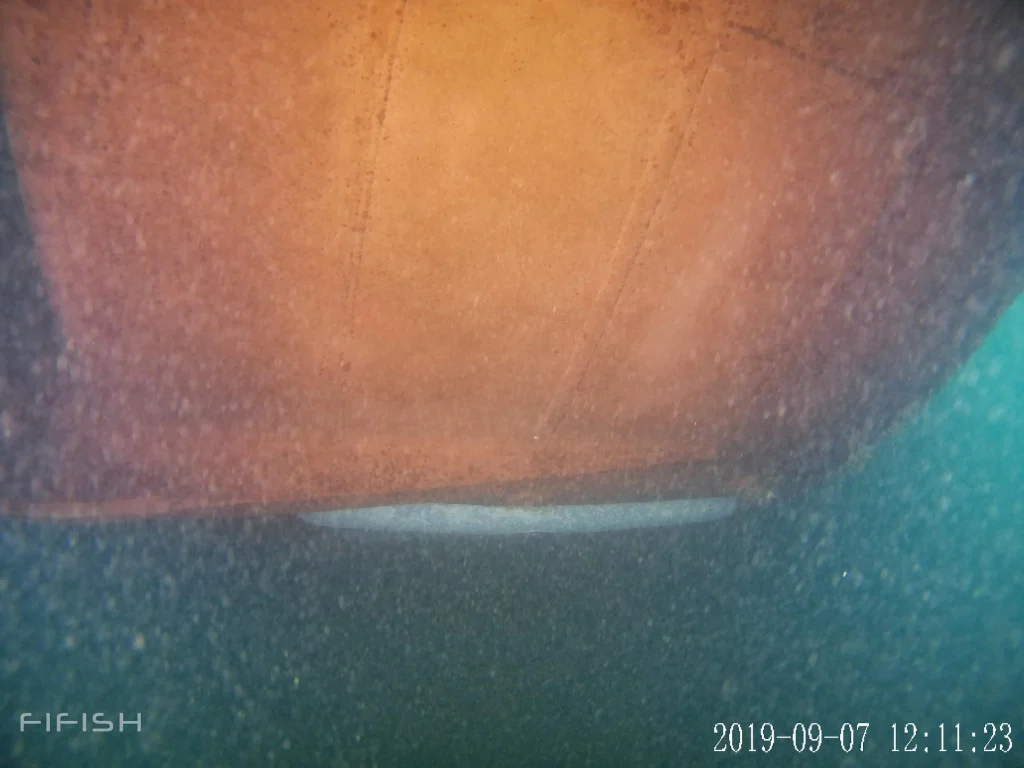
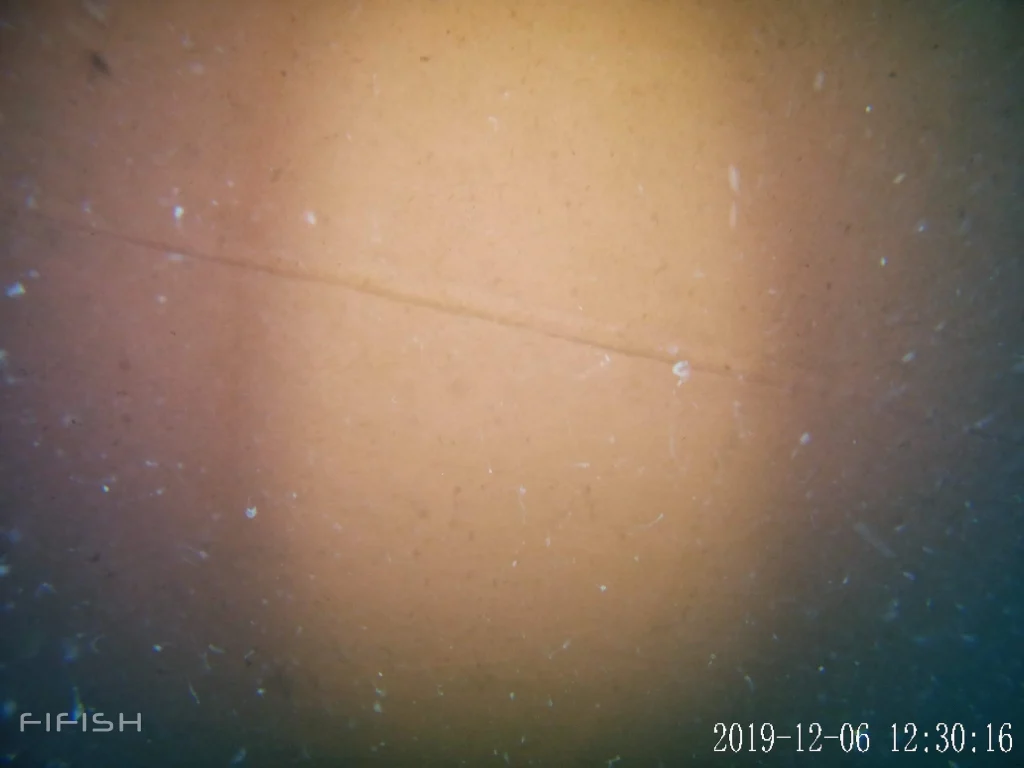
Underwater camera inspections a year after docking found clean paint and no weed or barnacle growth on the first and second fitted tugs.
First fitted tug, about 14 months on (underwater camera, September 2019): paint visible, no weed or barnacles.
Second fitted tug, a year after docking (underwater camera, December 2019).
The launches
A port launch that had needed a dive clean every two months did not need one at its two-month check, and went more than six months without one.
How to read these figures
The figures come from the operator’s own fuel and engine-hour records, as summarised by GLOBAtech’s Chilean partner in December 2019. The operator’s data is confidential, so the charts show indexed values read from the partner’s review. There was one unfitted comparison tug, and fuel per engine hour also moves with the work a tug does, so the comparison shows a direction rather than a controlled result. In a same-port comparison in December 2019 the fitted vessel also carried some fouling, less than the unfitted one. Named fleet references are available to prospective customers on request.
What ENVSonic adds
In 2018 the evidence was photographs, fuel logs and the crew’s word. ENVSonic tests and calibrates every channel daily and records the result on the dashboard, so an operator can show that every transducer was working throughout, not just that the hull looked clean on inspection day. ENVSonic carries a three-year warranty, or five years with a Monitoring & Maintenance plan.
We use Google Analytics to see which pages help visitors, with IP addresses anonymised and no advertising. Essential cookies are always on. Privacy policy